|
|
An Introduction to Trend Hedging
PBD Risk Abatement – Trend Triggers
Abate risk and optimize profit through the use of trend hedging with the use of PBD Trend Triggers while maintaining equity preservation through the use of hedges and options. Trend Triggers can also be utilized for market speculation.
PBD Trend Triggers base formulas were initially developed in the 1980’s and they have evolved over the years. Today PBD has refined these calculations into a single advanced algorithm that gives a clear numeric indicator to sell/hedged or buy/unhedged (with an option floor). The PBD Trend Trigger allows for vector value function of time, velocity, volatility, range, rate of change, etc. The results require matching to risk abatement goals and execution to the parameters of the hedge strategy. PBD can provide exact Hedge Activation Price Points.
PBD retains the Intellectual Property Rights to the algorithms that generate the trend shift calculation as well as the Hedge Activation Price Point calculation. These calculations have been refined for risk abatement and are currently developed to a high degree of accuracy.
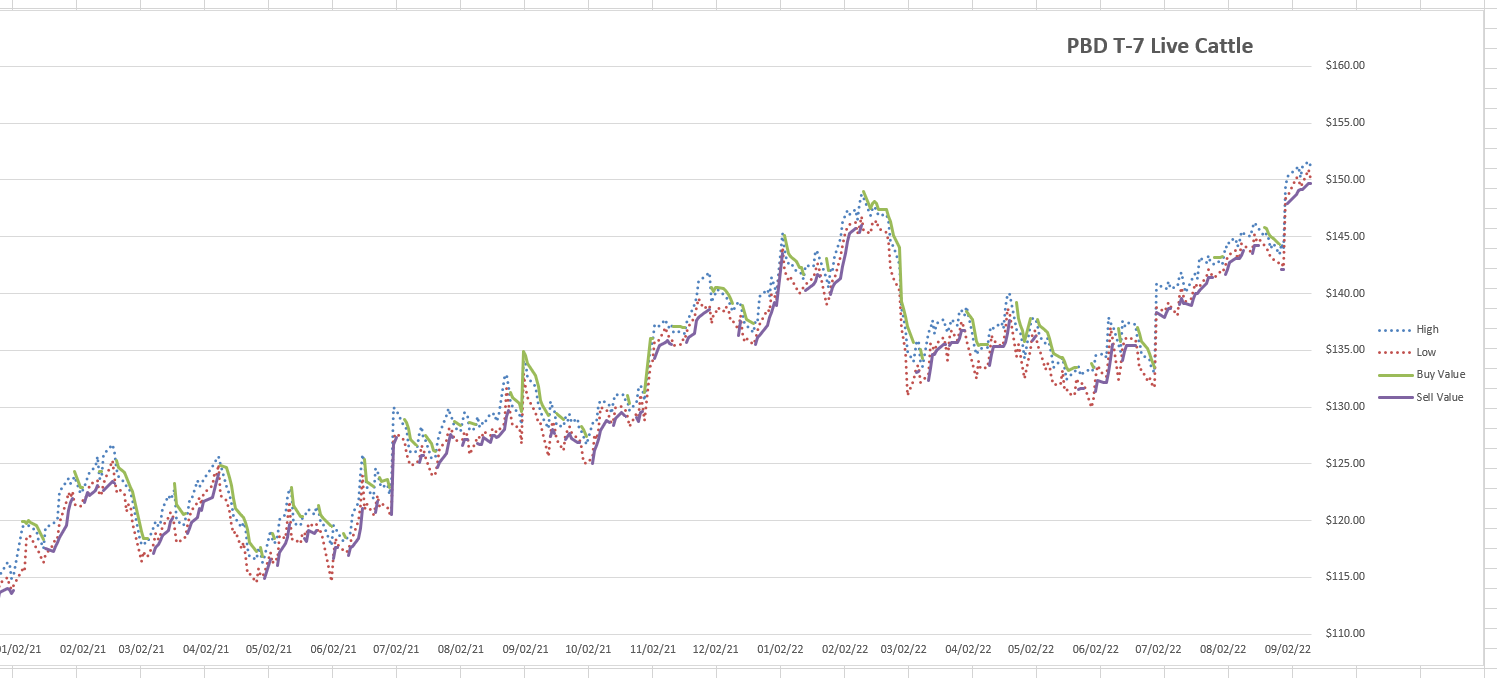
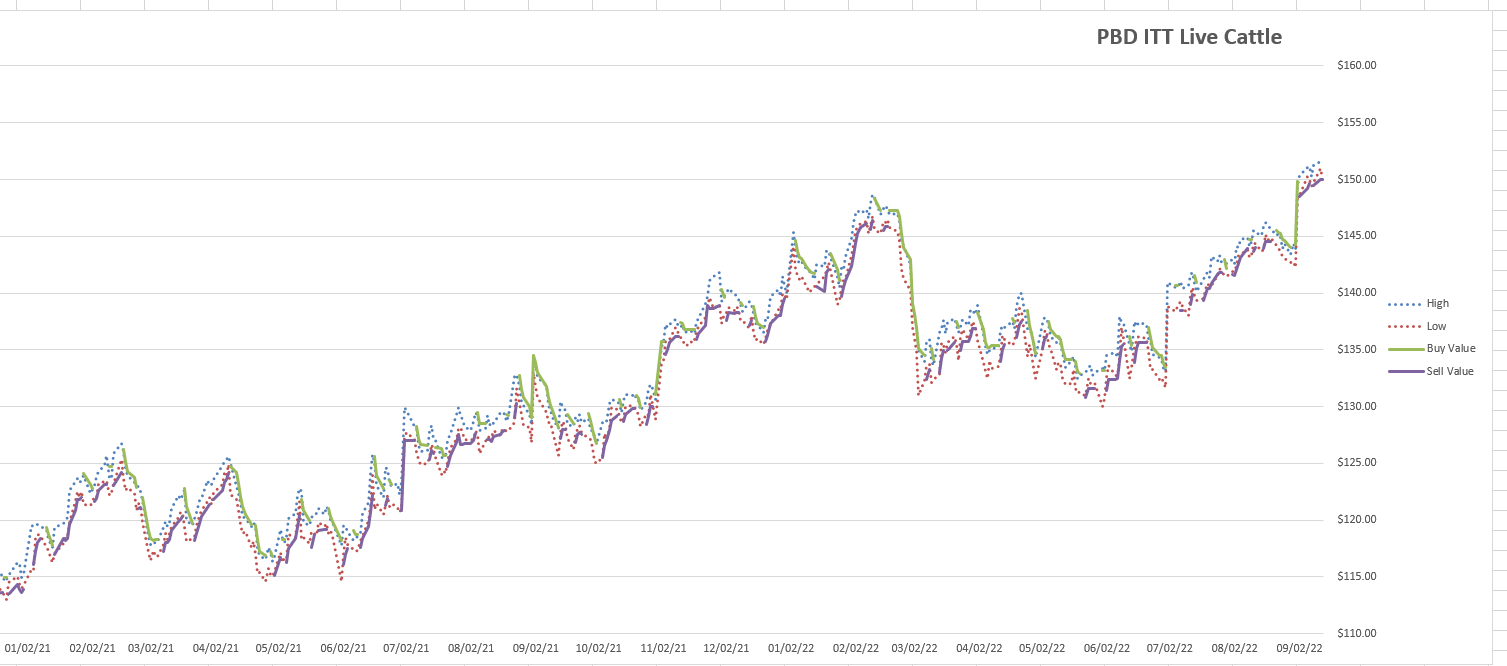
Live Cattle
Trend Trigger Daily Report - EXAMPLE

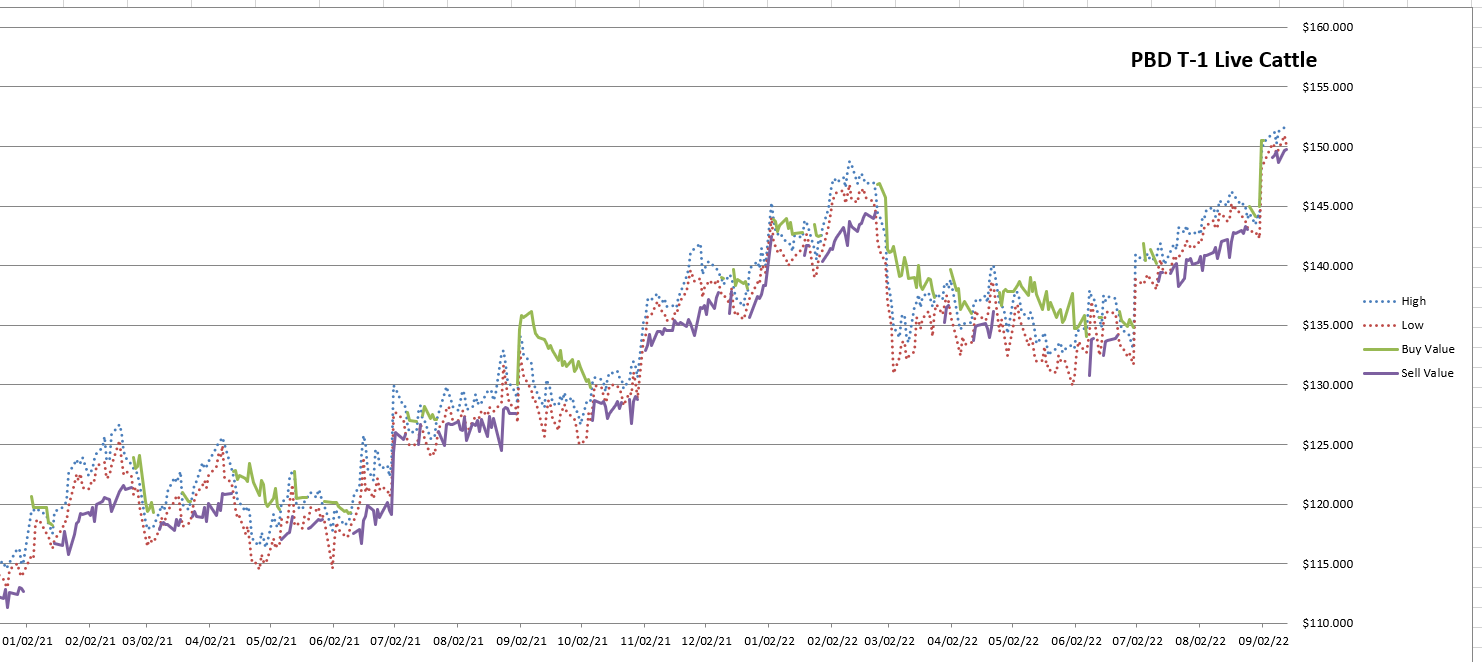
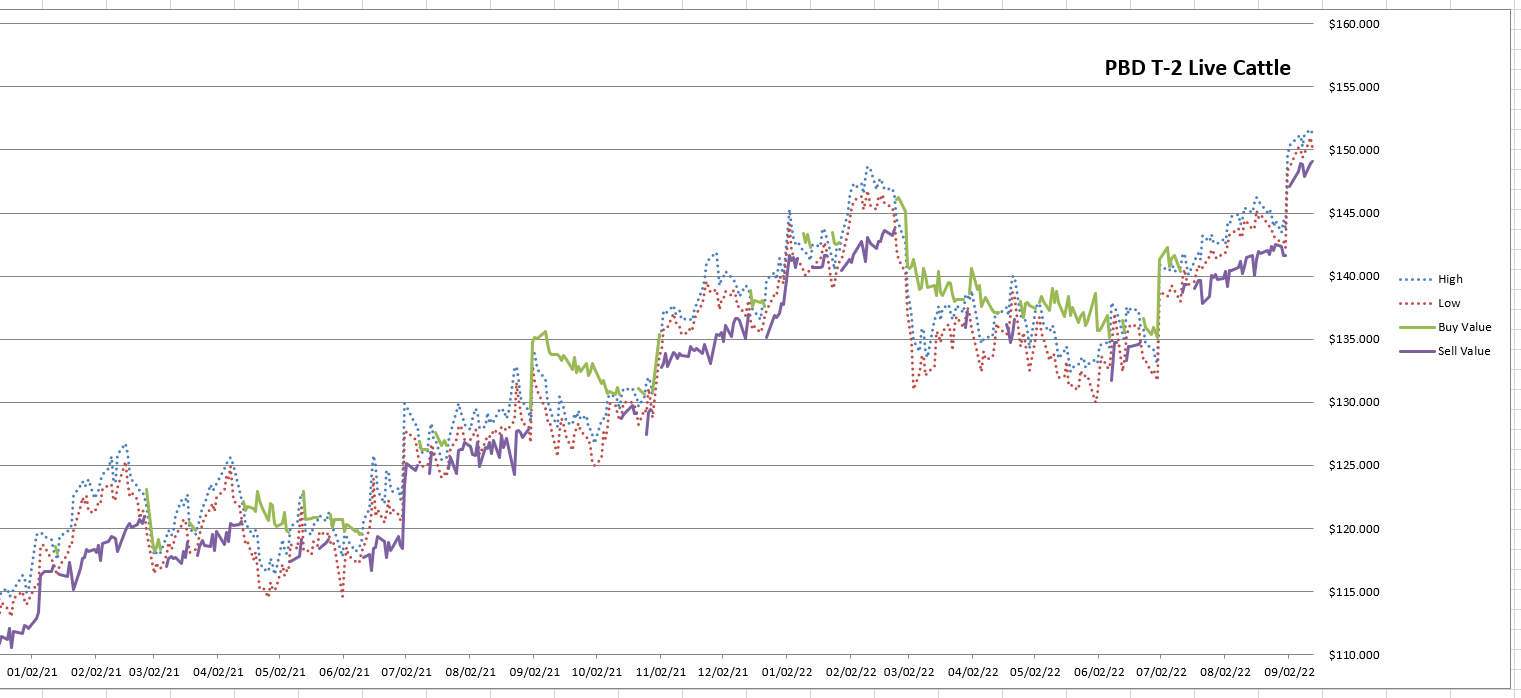
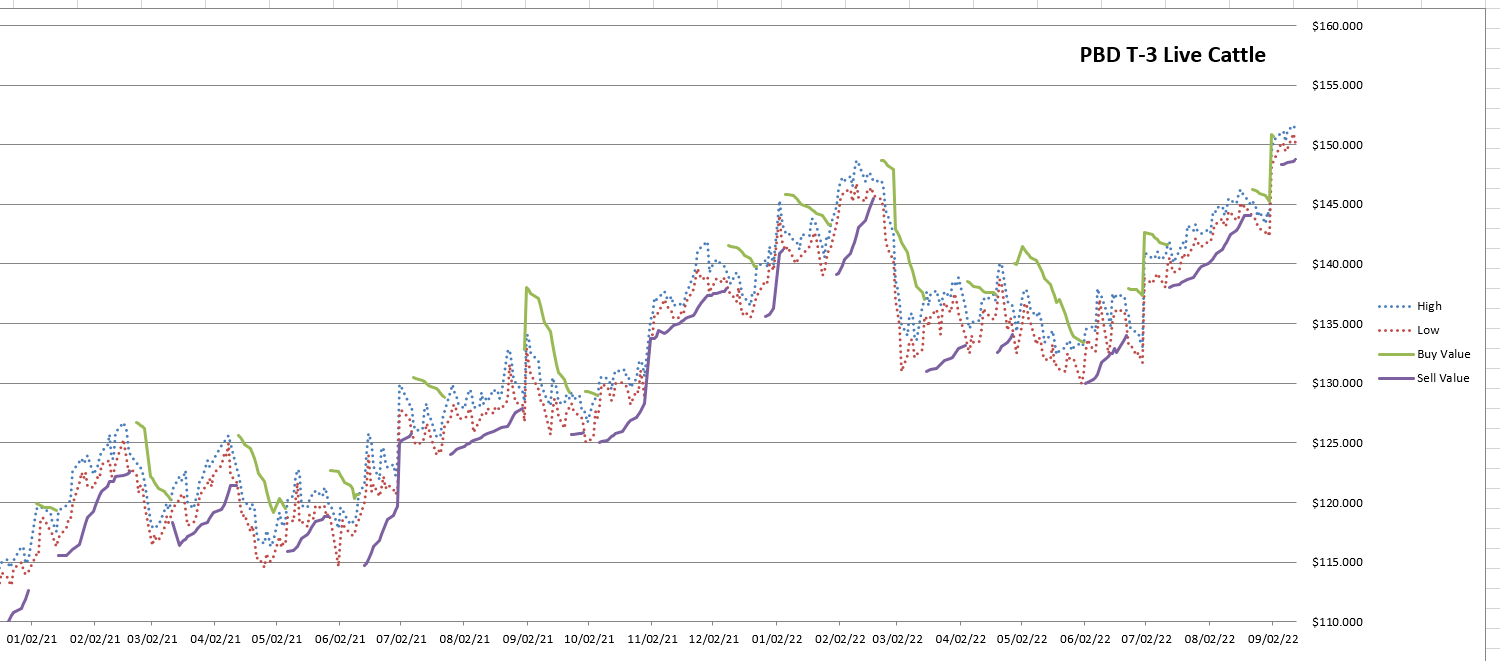
Live Cattle - Price Charts with Trigger Values (as of 9/13/22)
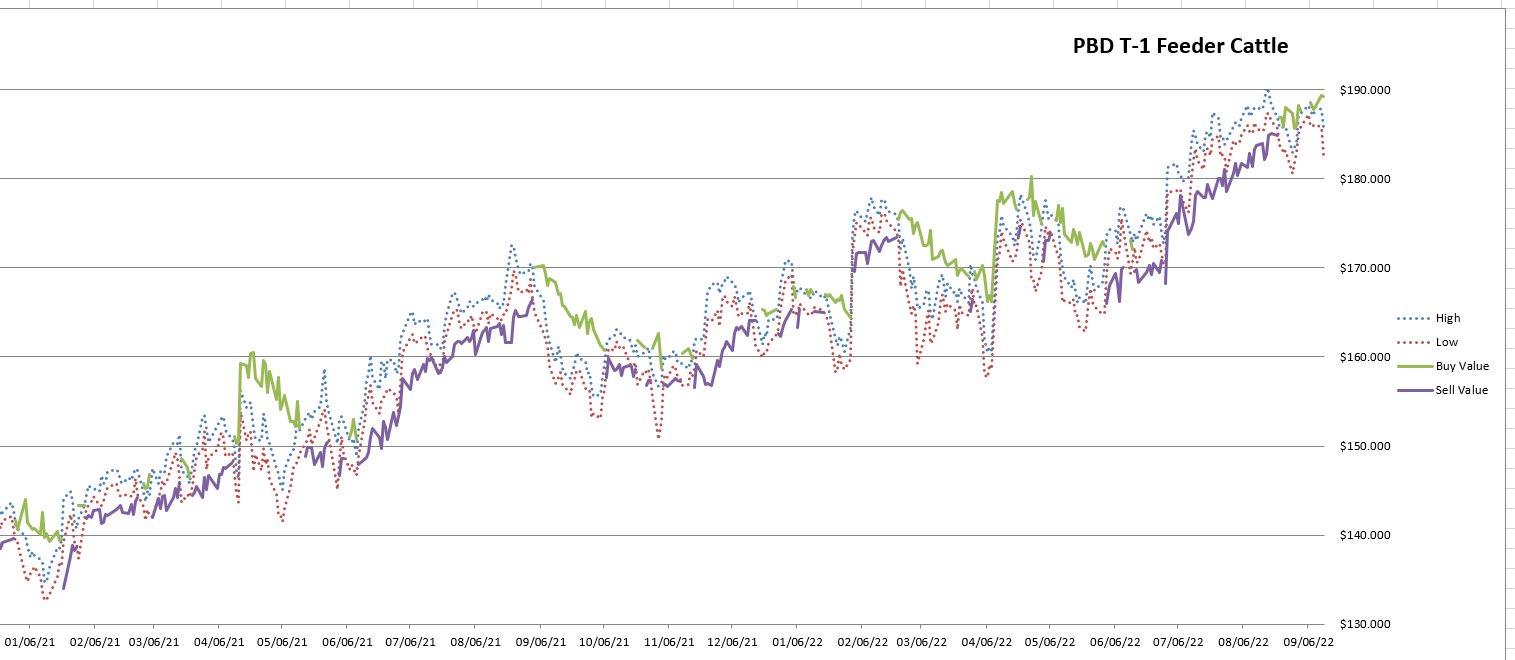
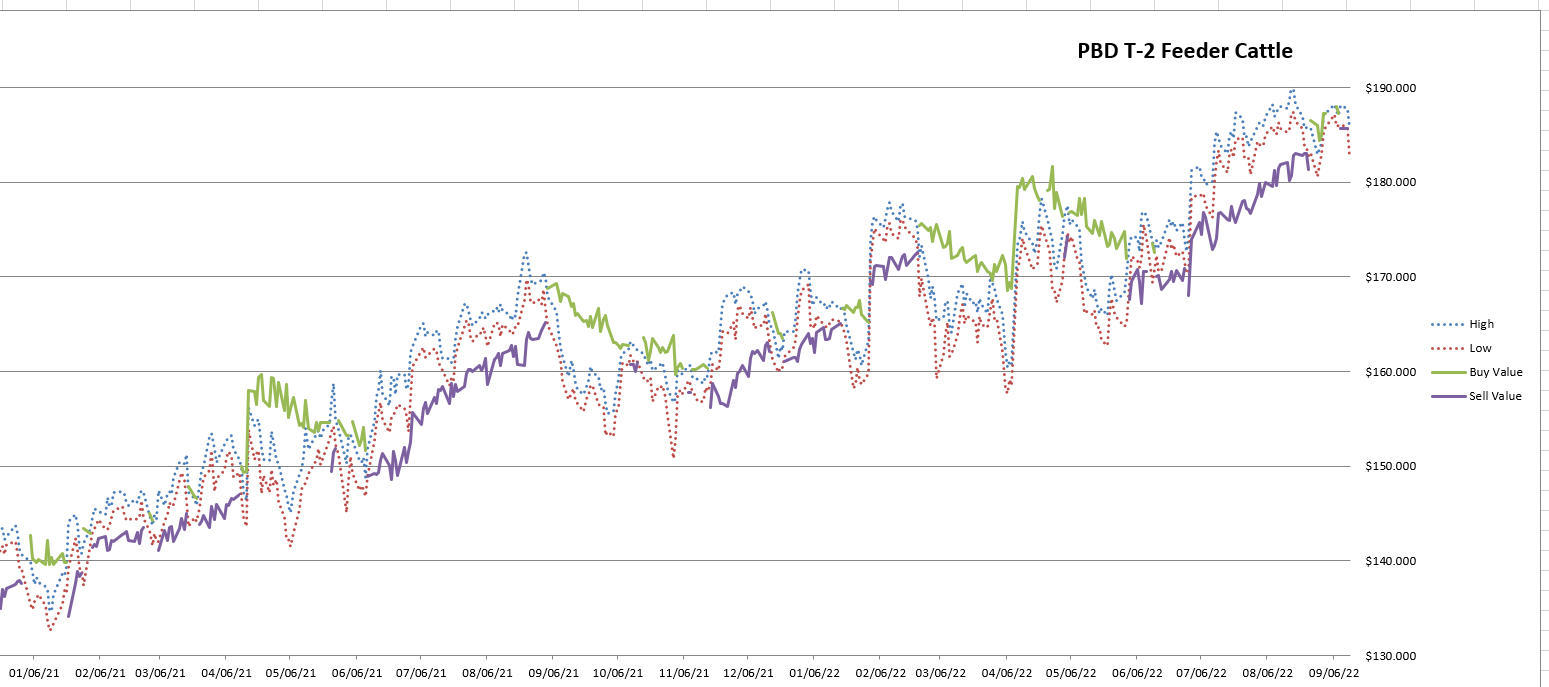
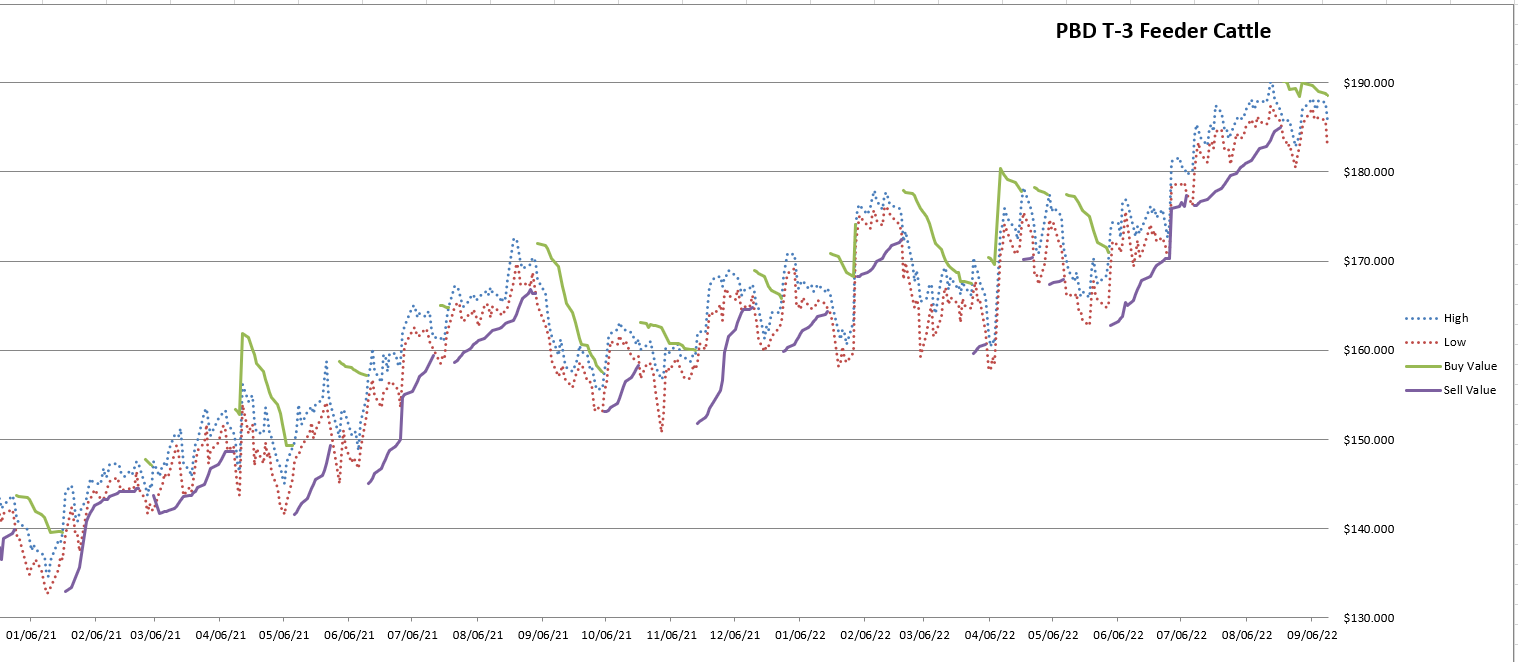
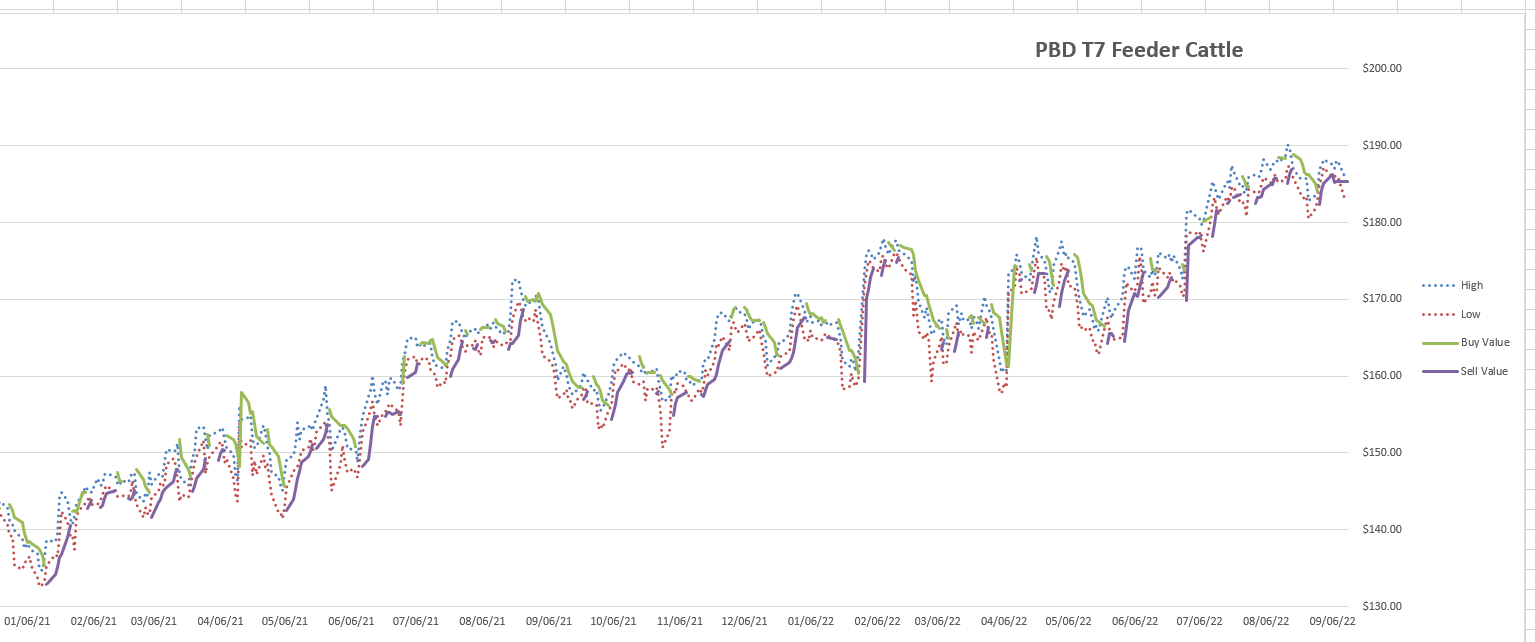
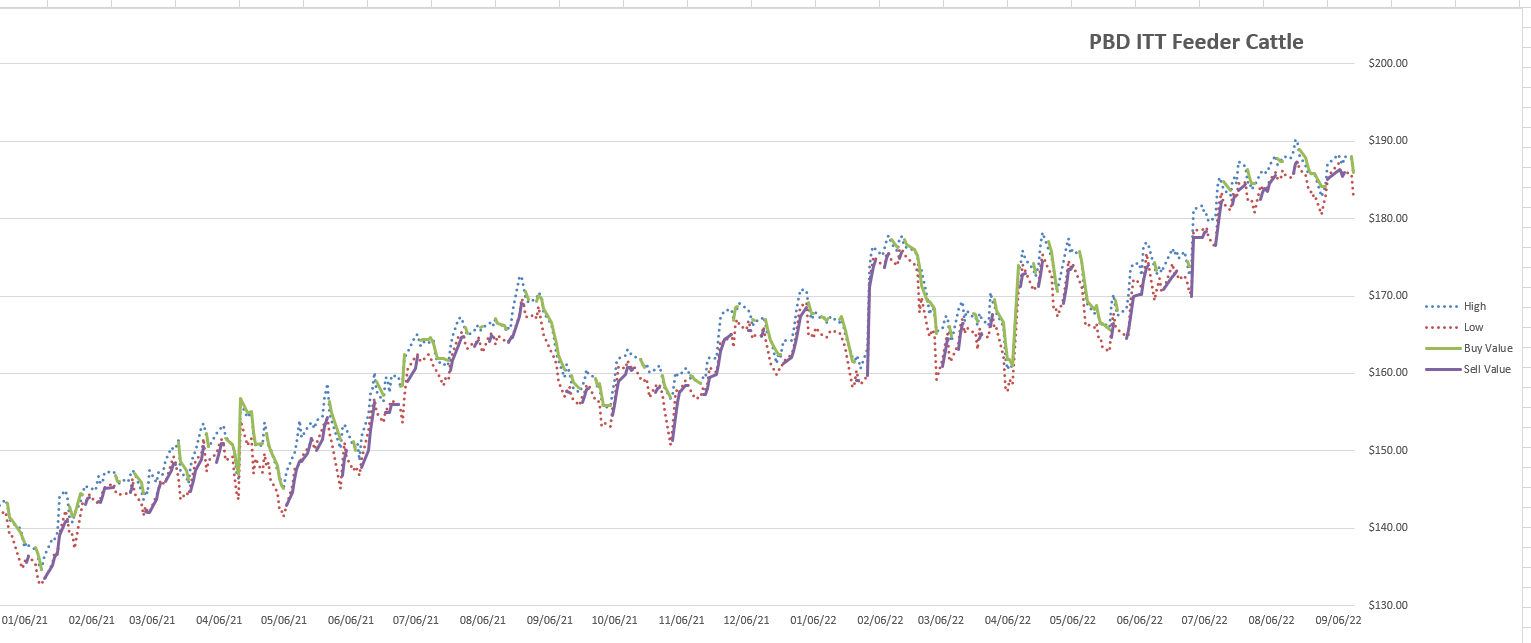
Feeder Cattle
Trend Trigger Daily Report - EXAMPLE
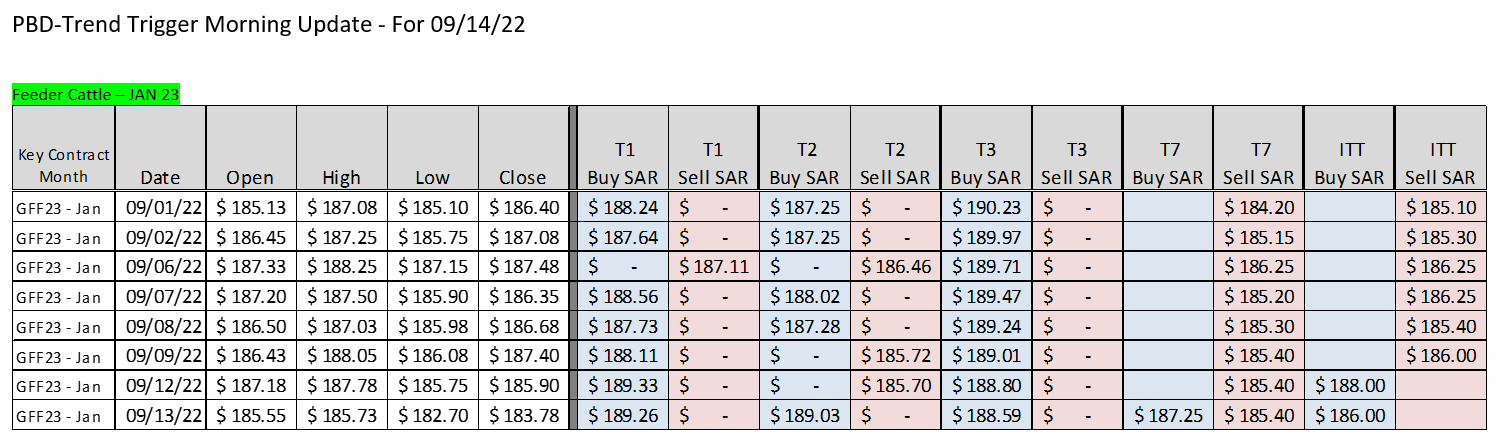
Feeder Cattle - Price Charts with Trigger Values (as of 9/13/22)
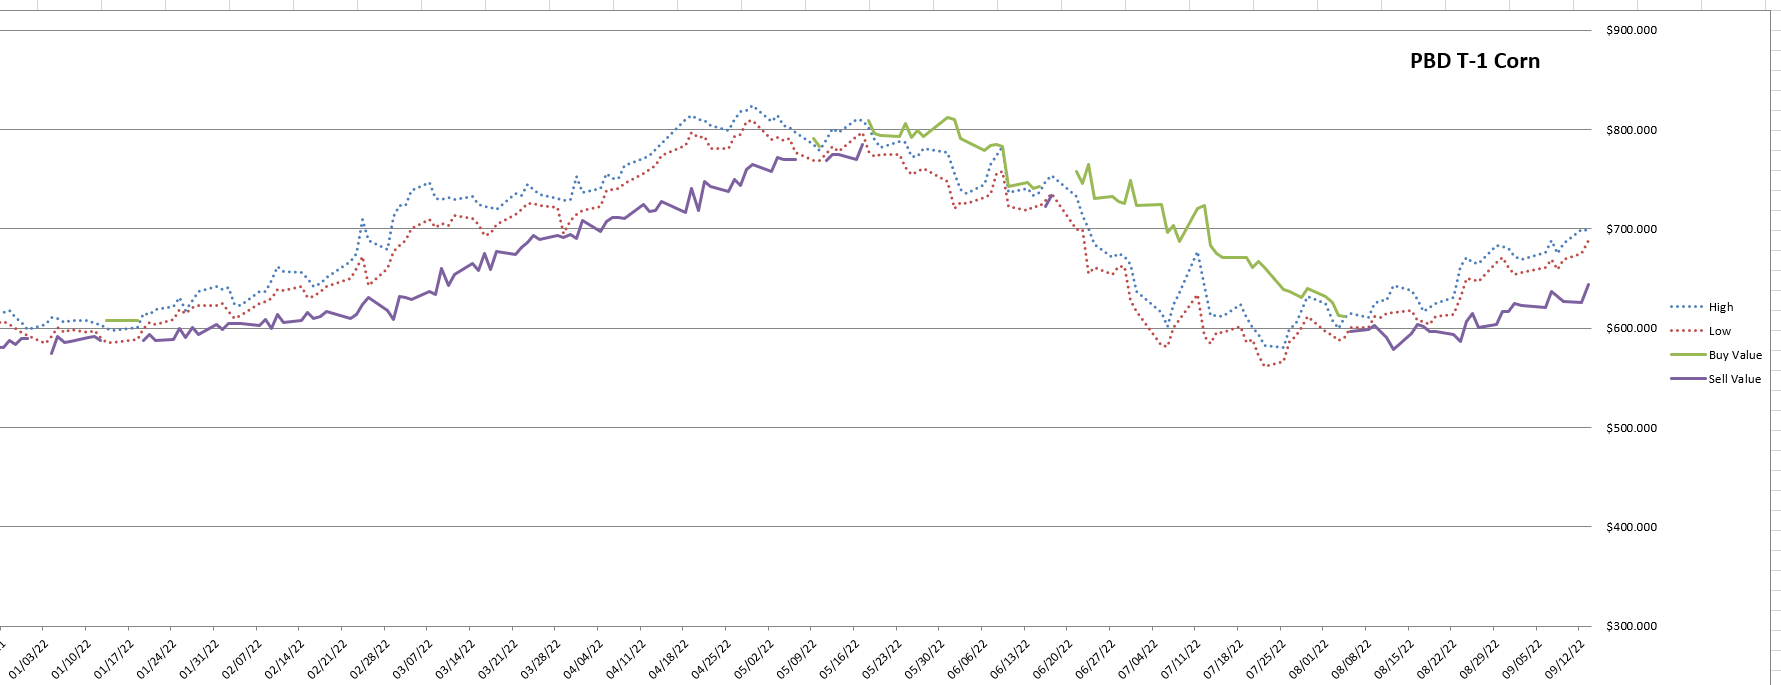
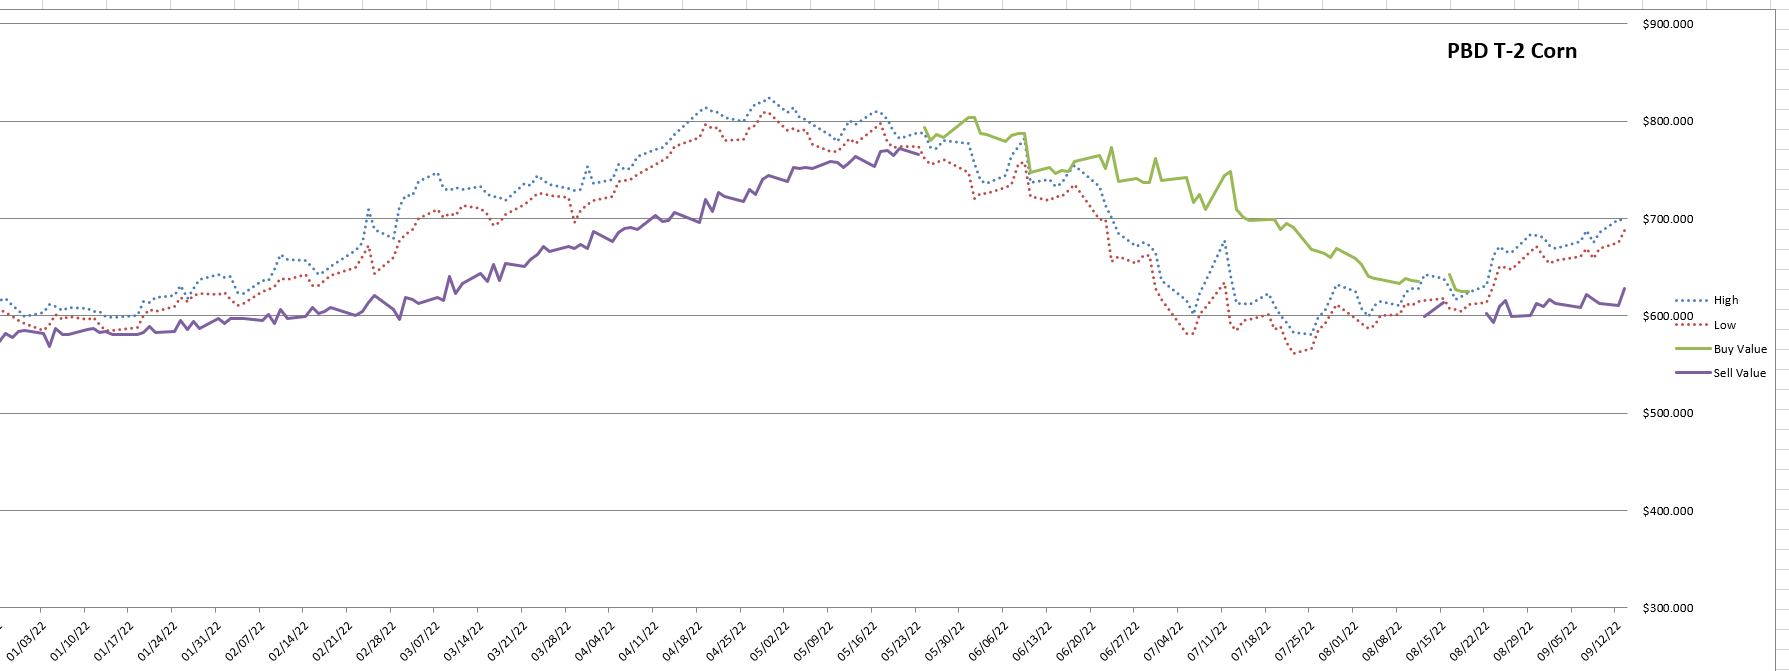
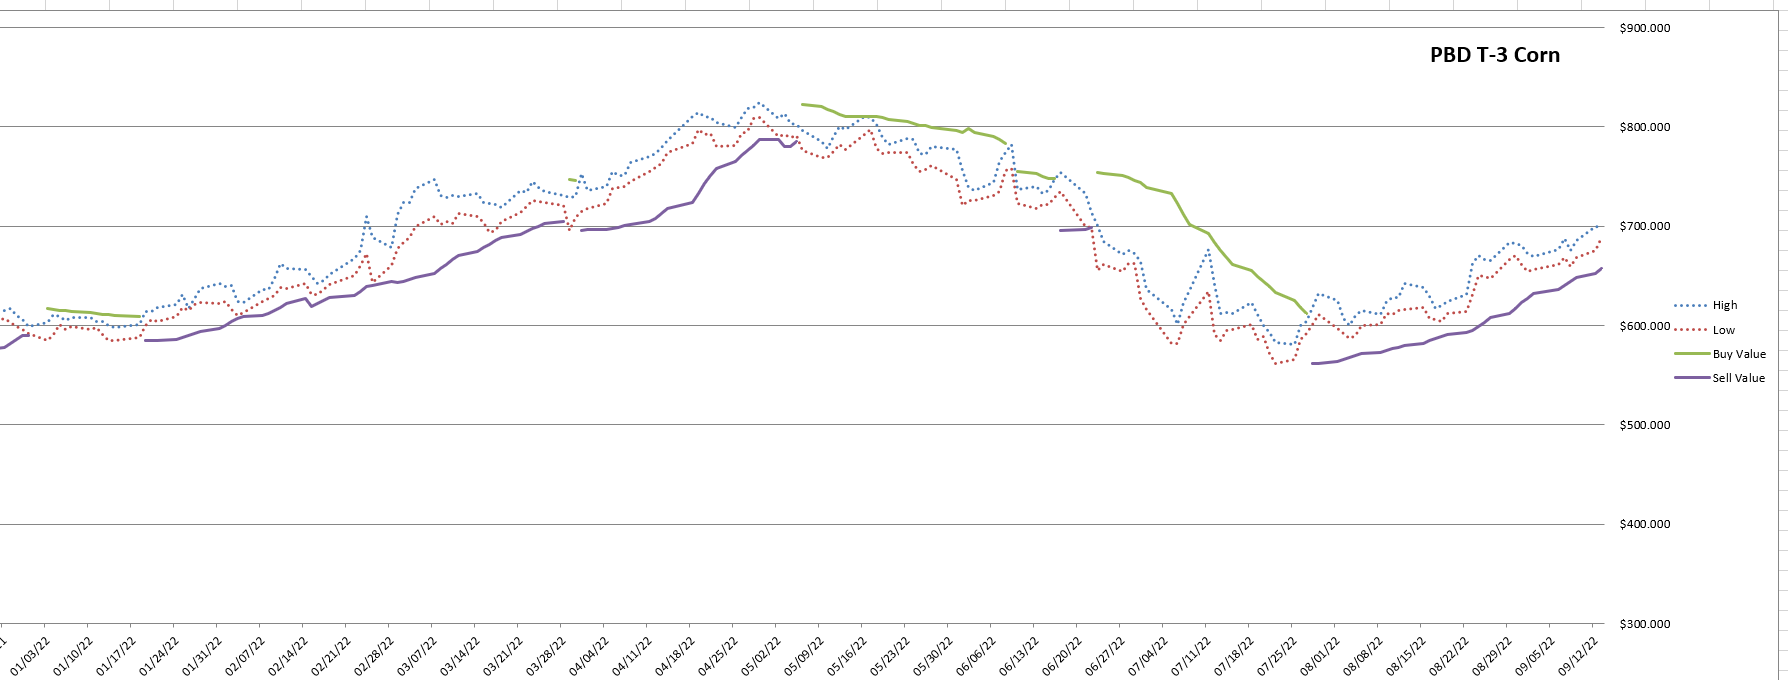
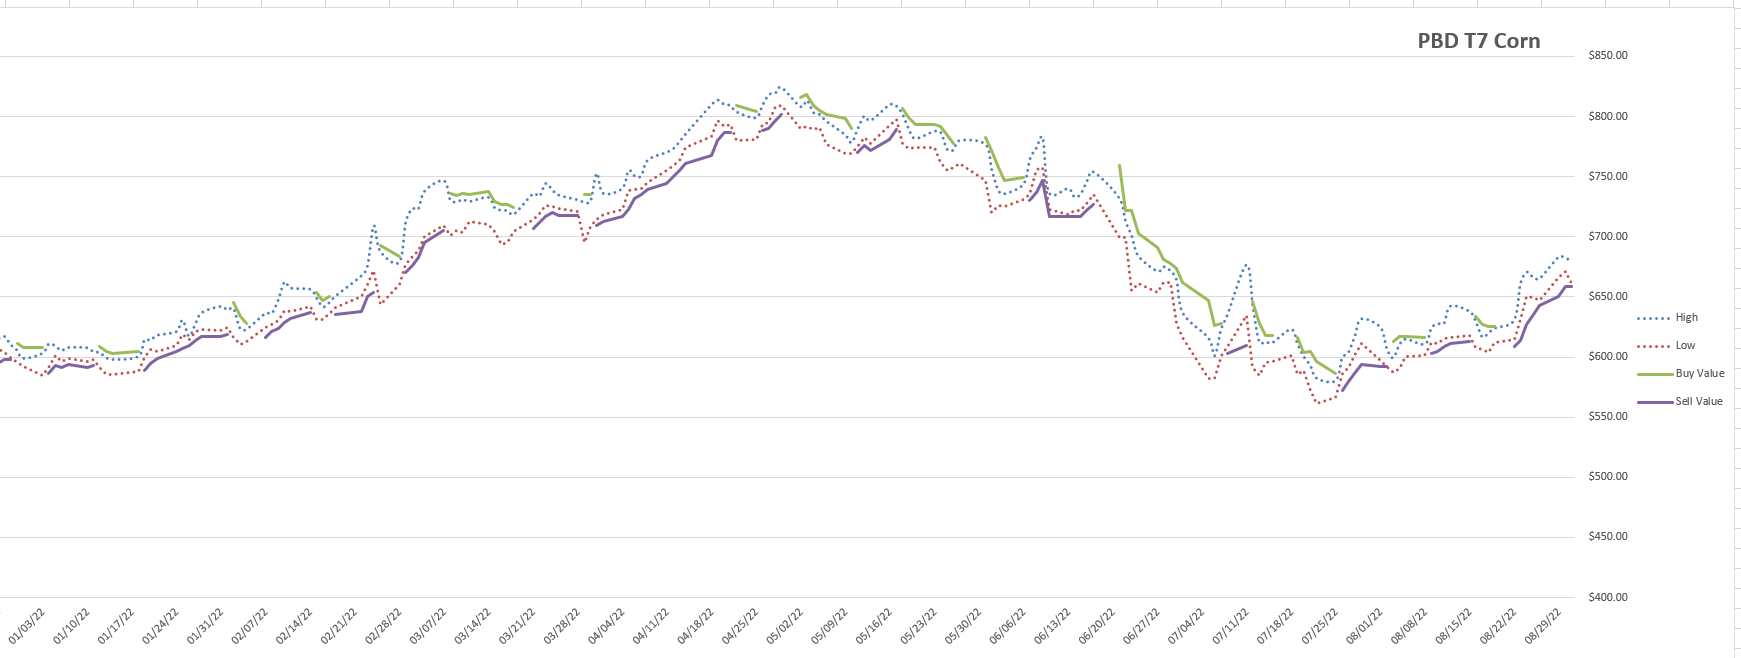
Corn
Trend Trigger Daily Report - EXAMPLE
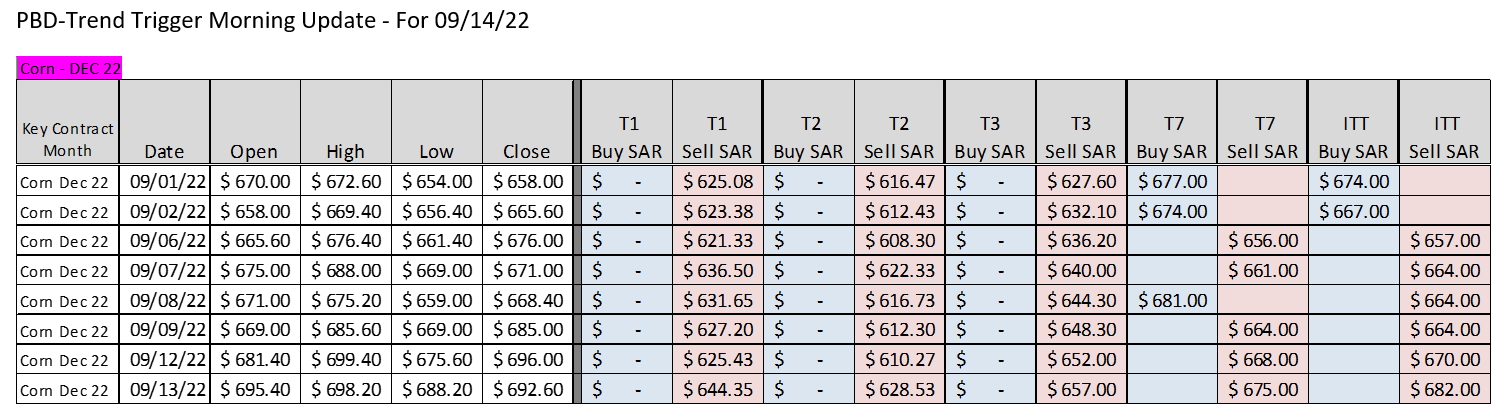
Corn - Price Charts with Trigger Values (as of 9/13/22)

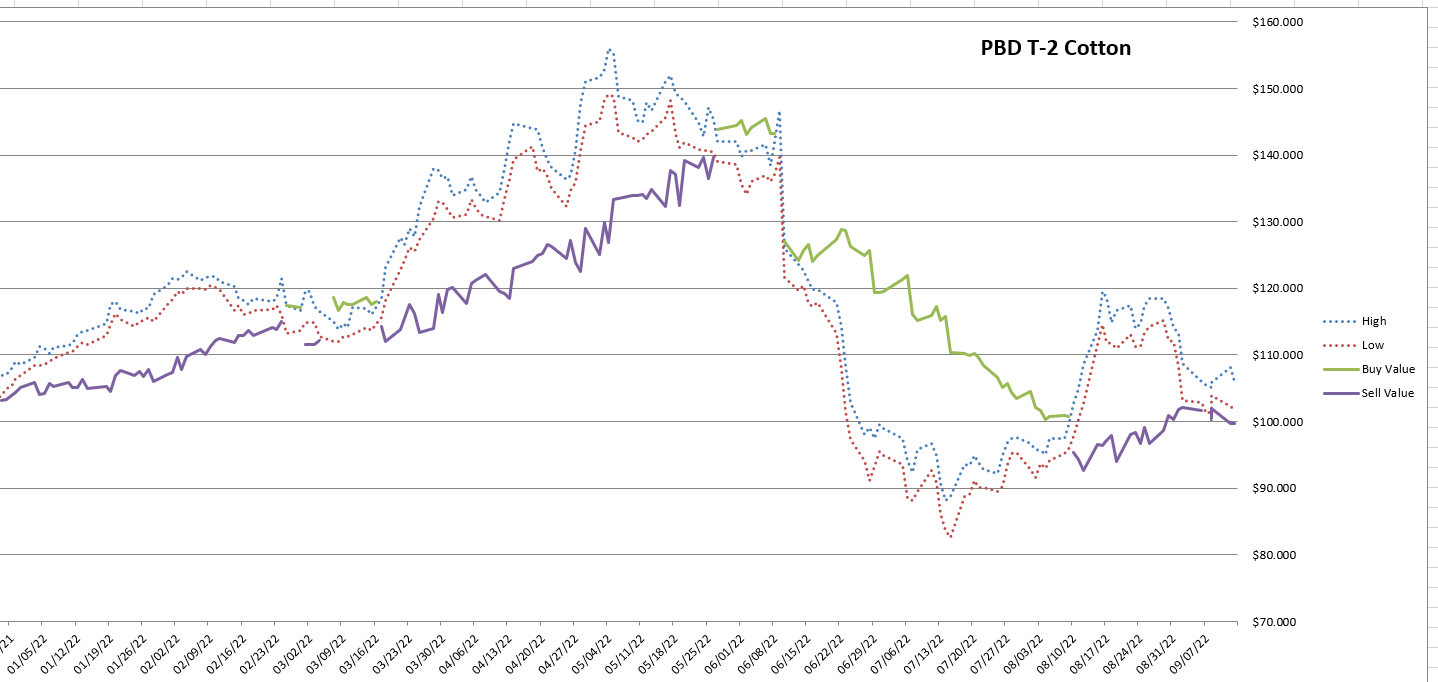
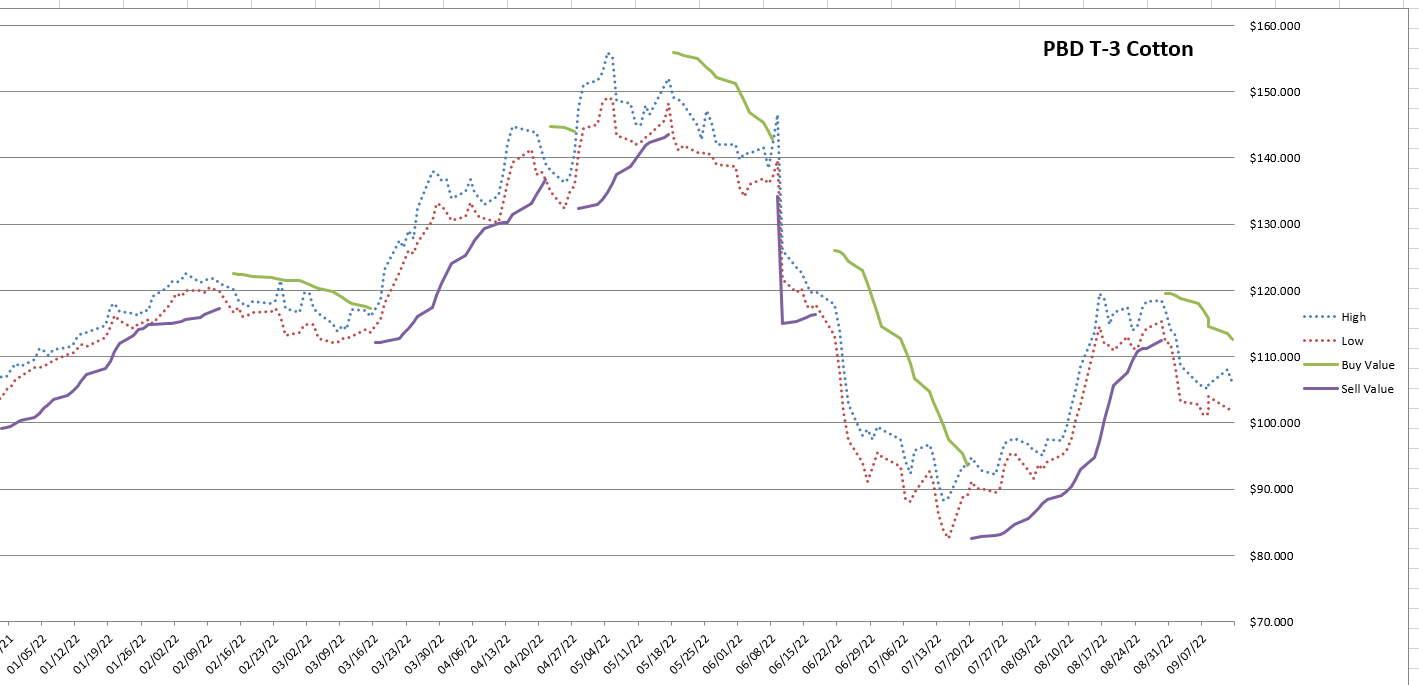
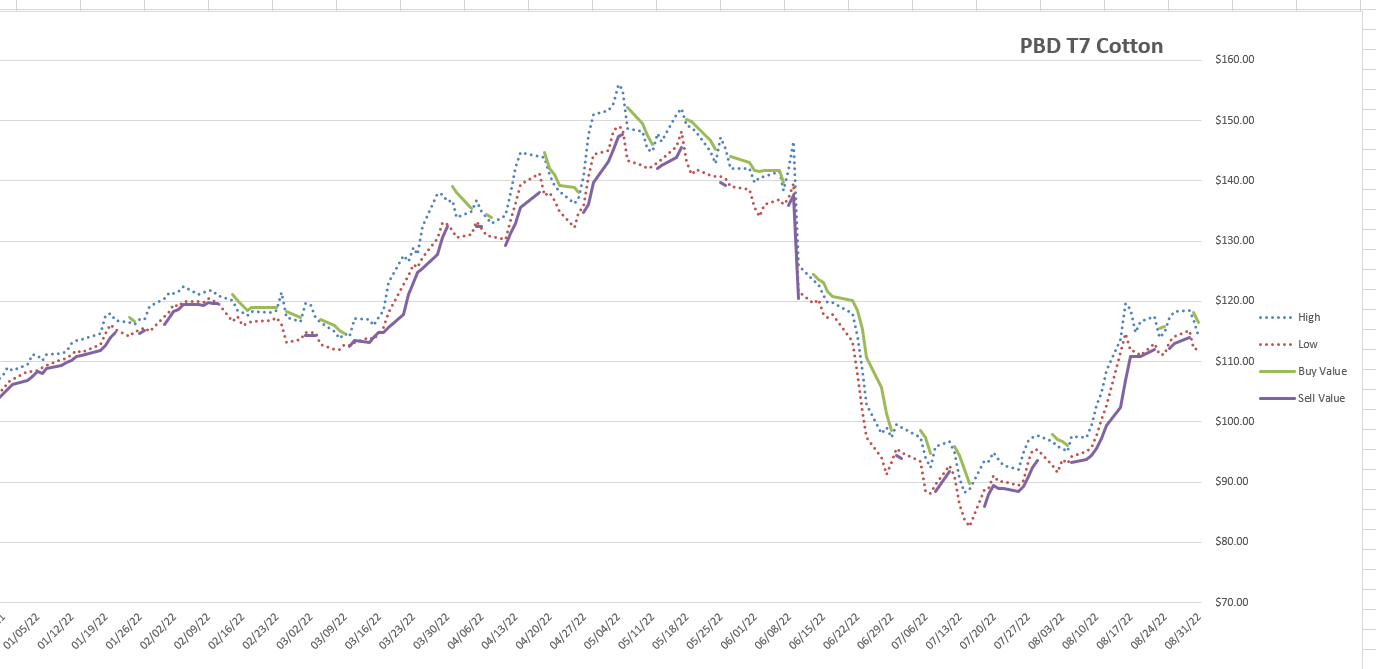
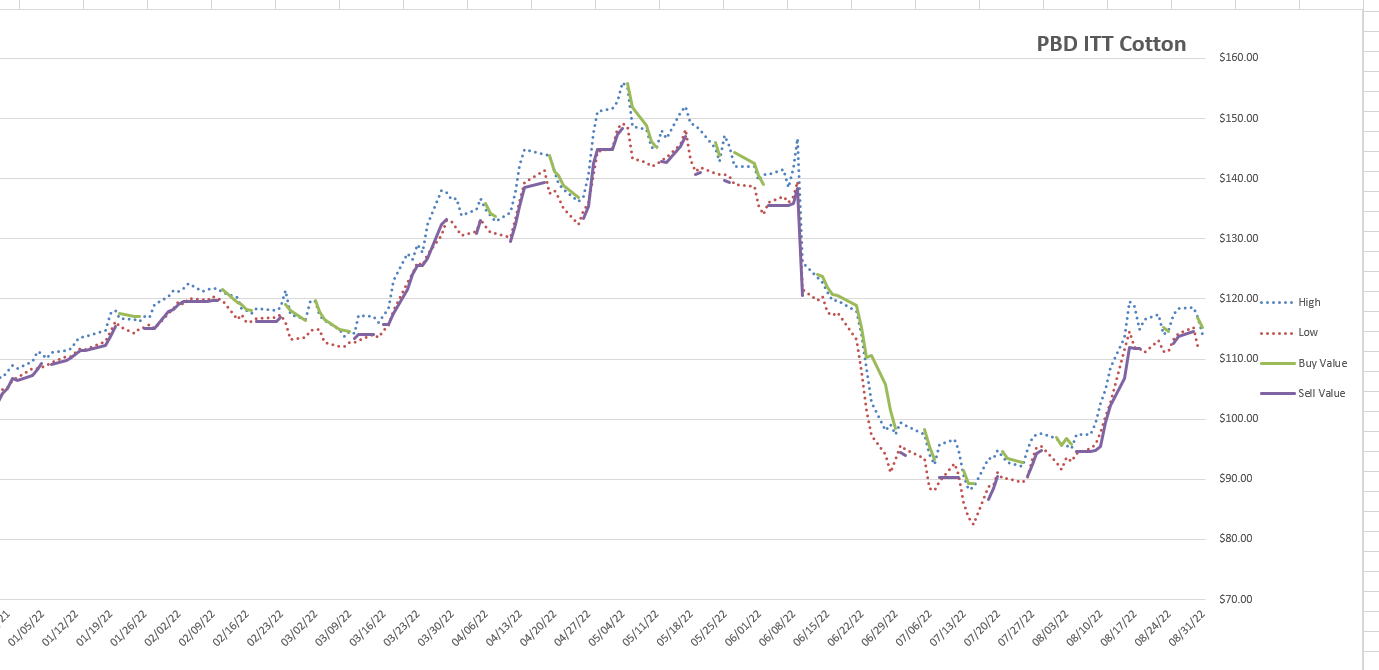
Cotton
Trend Trigger Daily Report - EXAMPLE
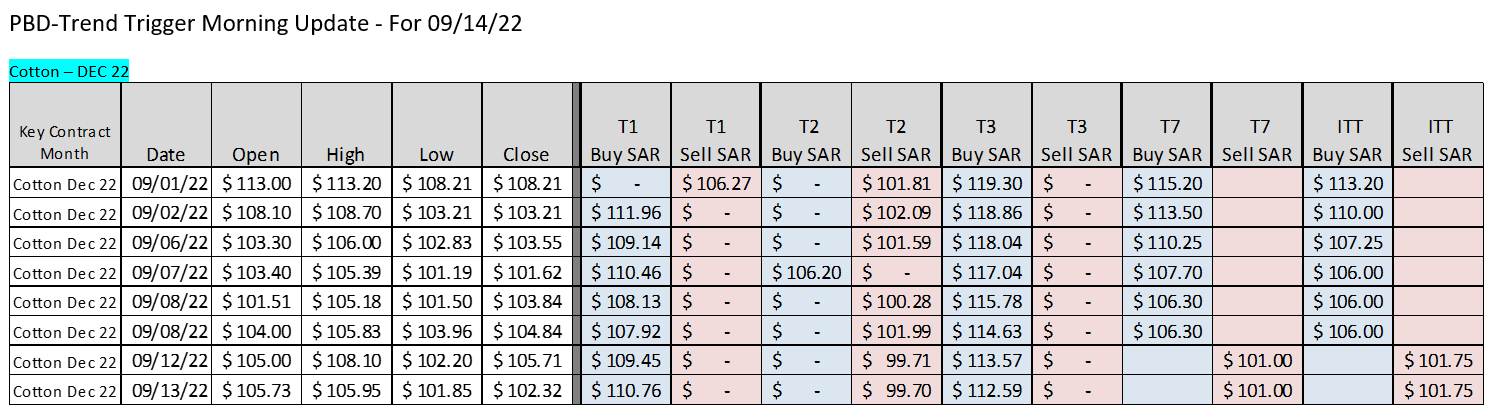
Cotton - Price Charts with Trigger Values (as of 9/13/22)

Bimonthly Reports - 2018 & older
| jly-aug_2018_bi-monthly_report__final__pbd_trend_triggers.pdf |
| may-jun_2018_bi-monthly_report__final__pbd_trend_triggers.pdf |
| Mar - Apr 2018 Bi-Monthly Report (final) PBD Trend Triggers |
| Jan - Feb 2018 Bi-Monthly Report (final) PBD Trend Triggers |
| November - December 2017 Bi-Monthly Report (final) PBD Trend Triggers |
| September - October 2017 Bi-Monthly Report (final) PBD Trend Triggers |
| July - Aug 2017 Bi-Monthly Report (final) PBD Trend Triggers |
| May - June 2017 Bi-Monthly Report (final) PBD Trend Triggers |
| March - April 2017 Bi-Monthly Report (final) PBD Trend Triggers |
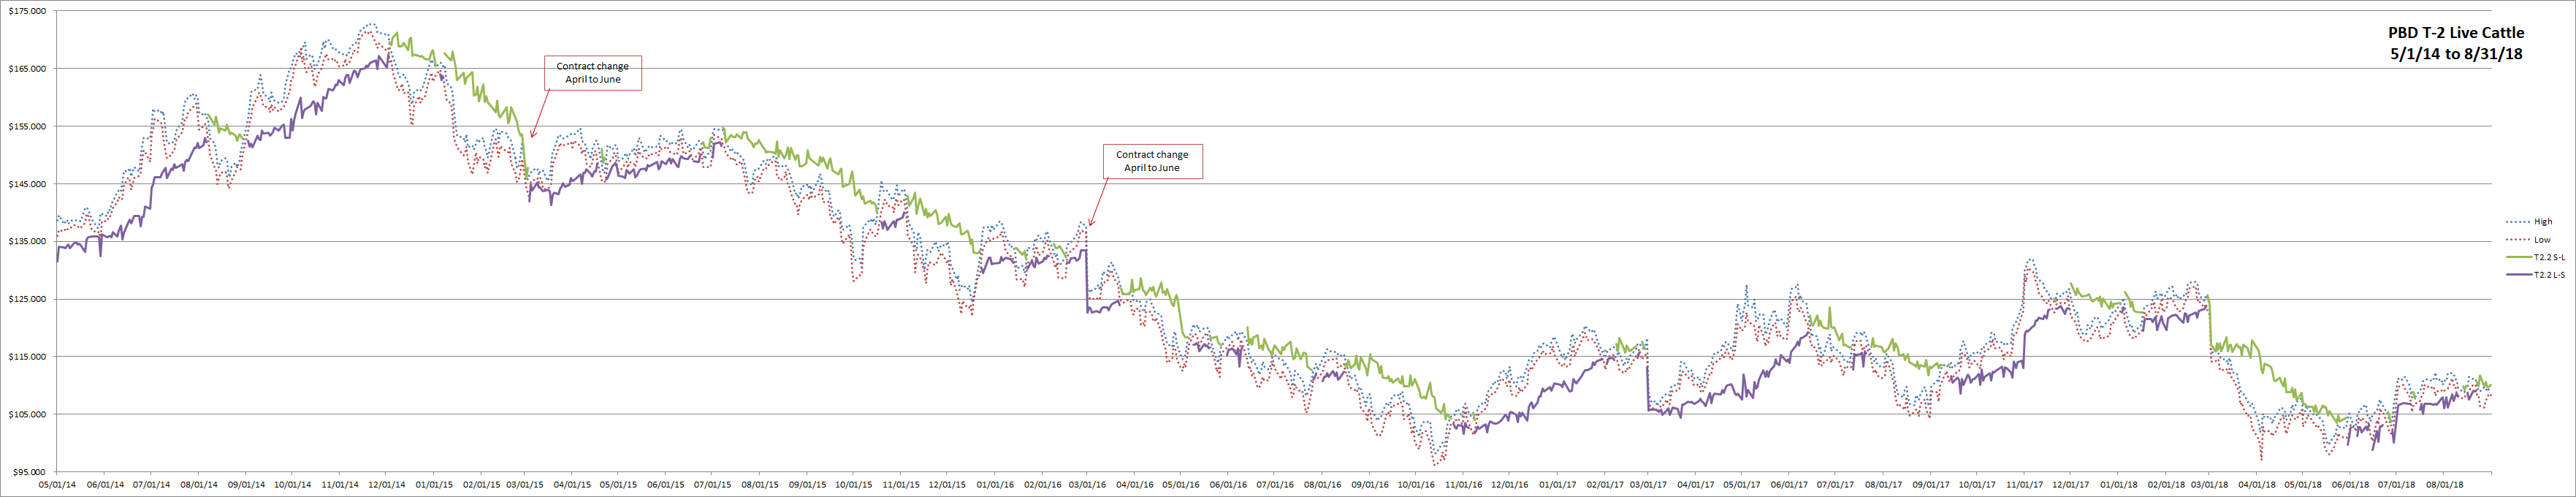
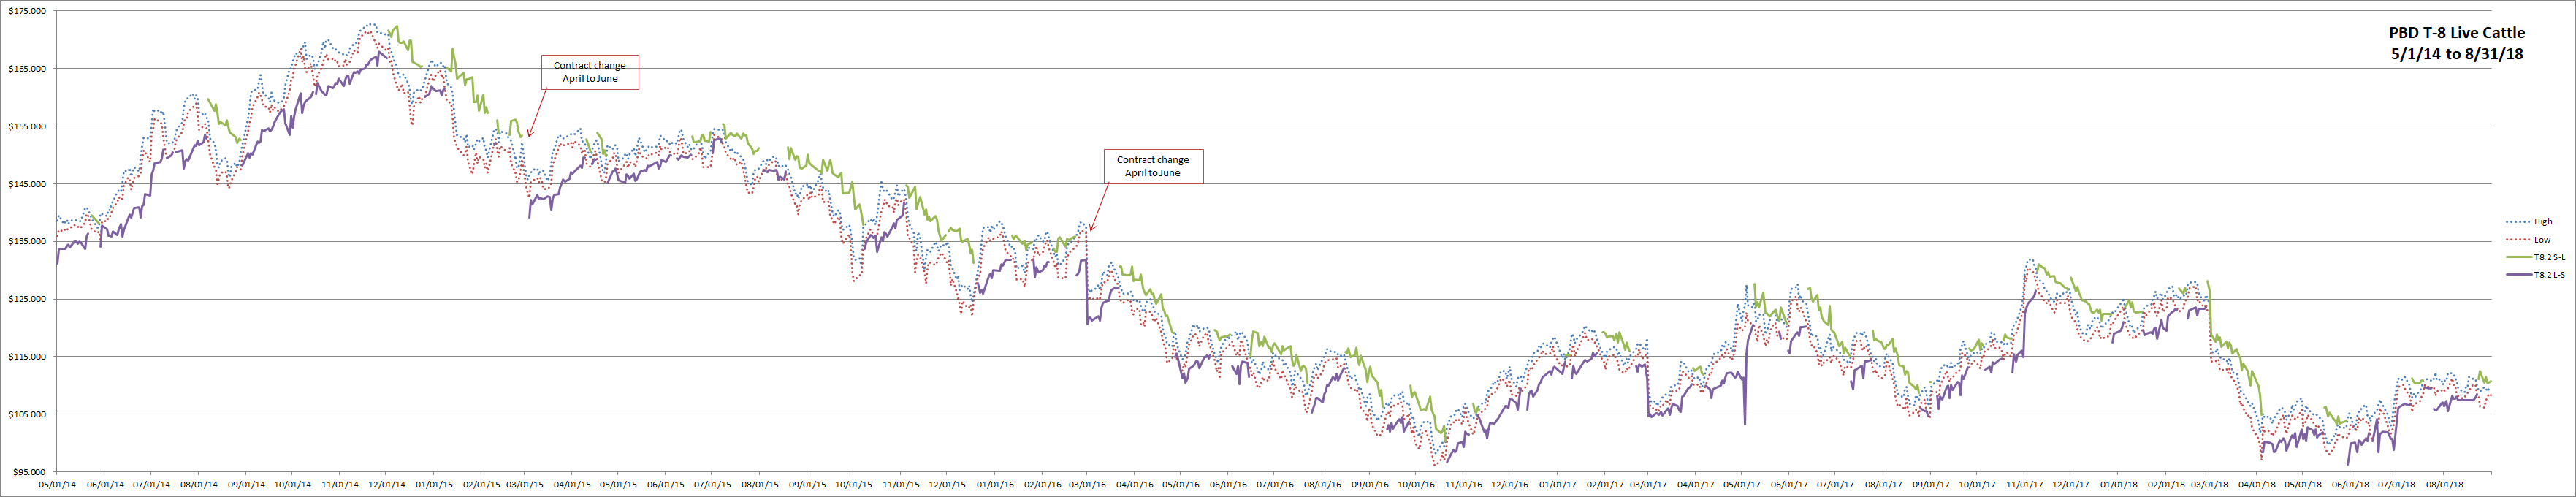
Continuation Charts With Trend Change Values - 2018 & older
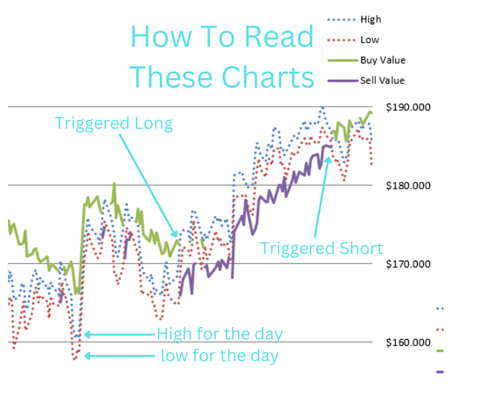
Below are the charts for T1, T2, T3 & T8 from 5/1/14 to 8/31/18. The charts show the daily high (blue dot) and low (red dot). You will notice the green line shows the trend change value to sell the market (go short) and the purple line shows the trend change value to buy the market (go long). When the chart pulls up, zoom in to see the detail.
| t1_20180831.png |
| t2_20180831.png |
| t3_20180831.png |
| t8_20180831.png |